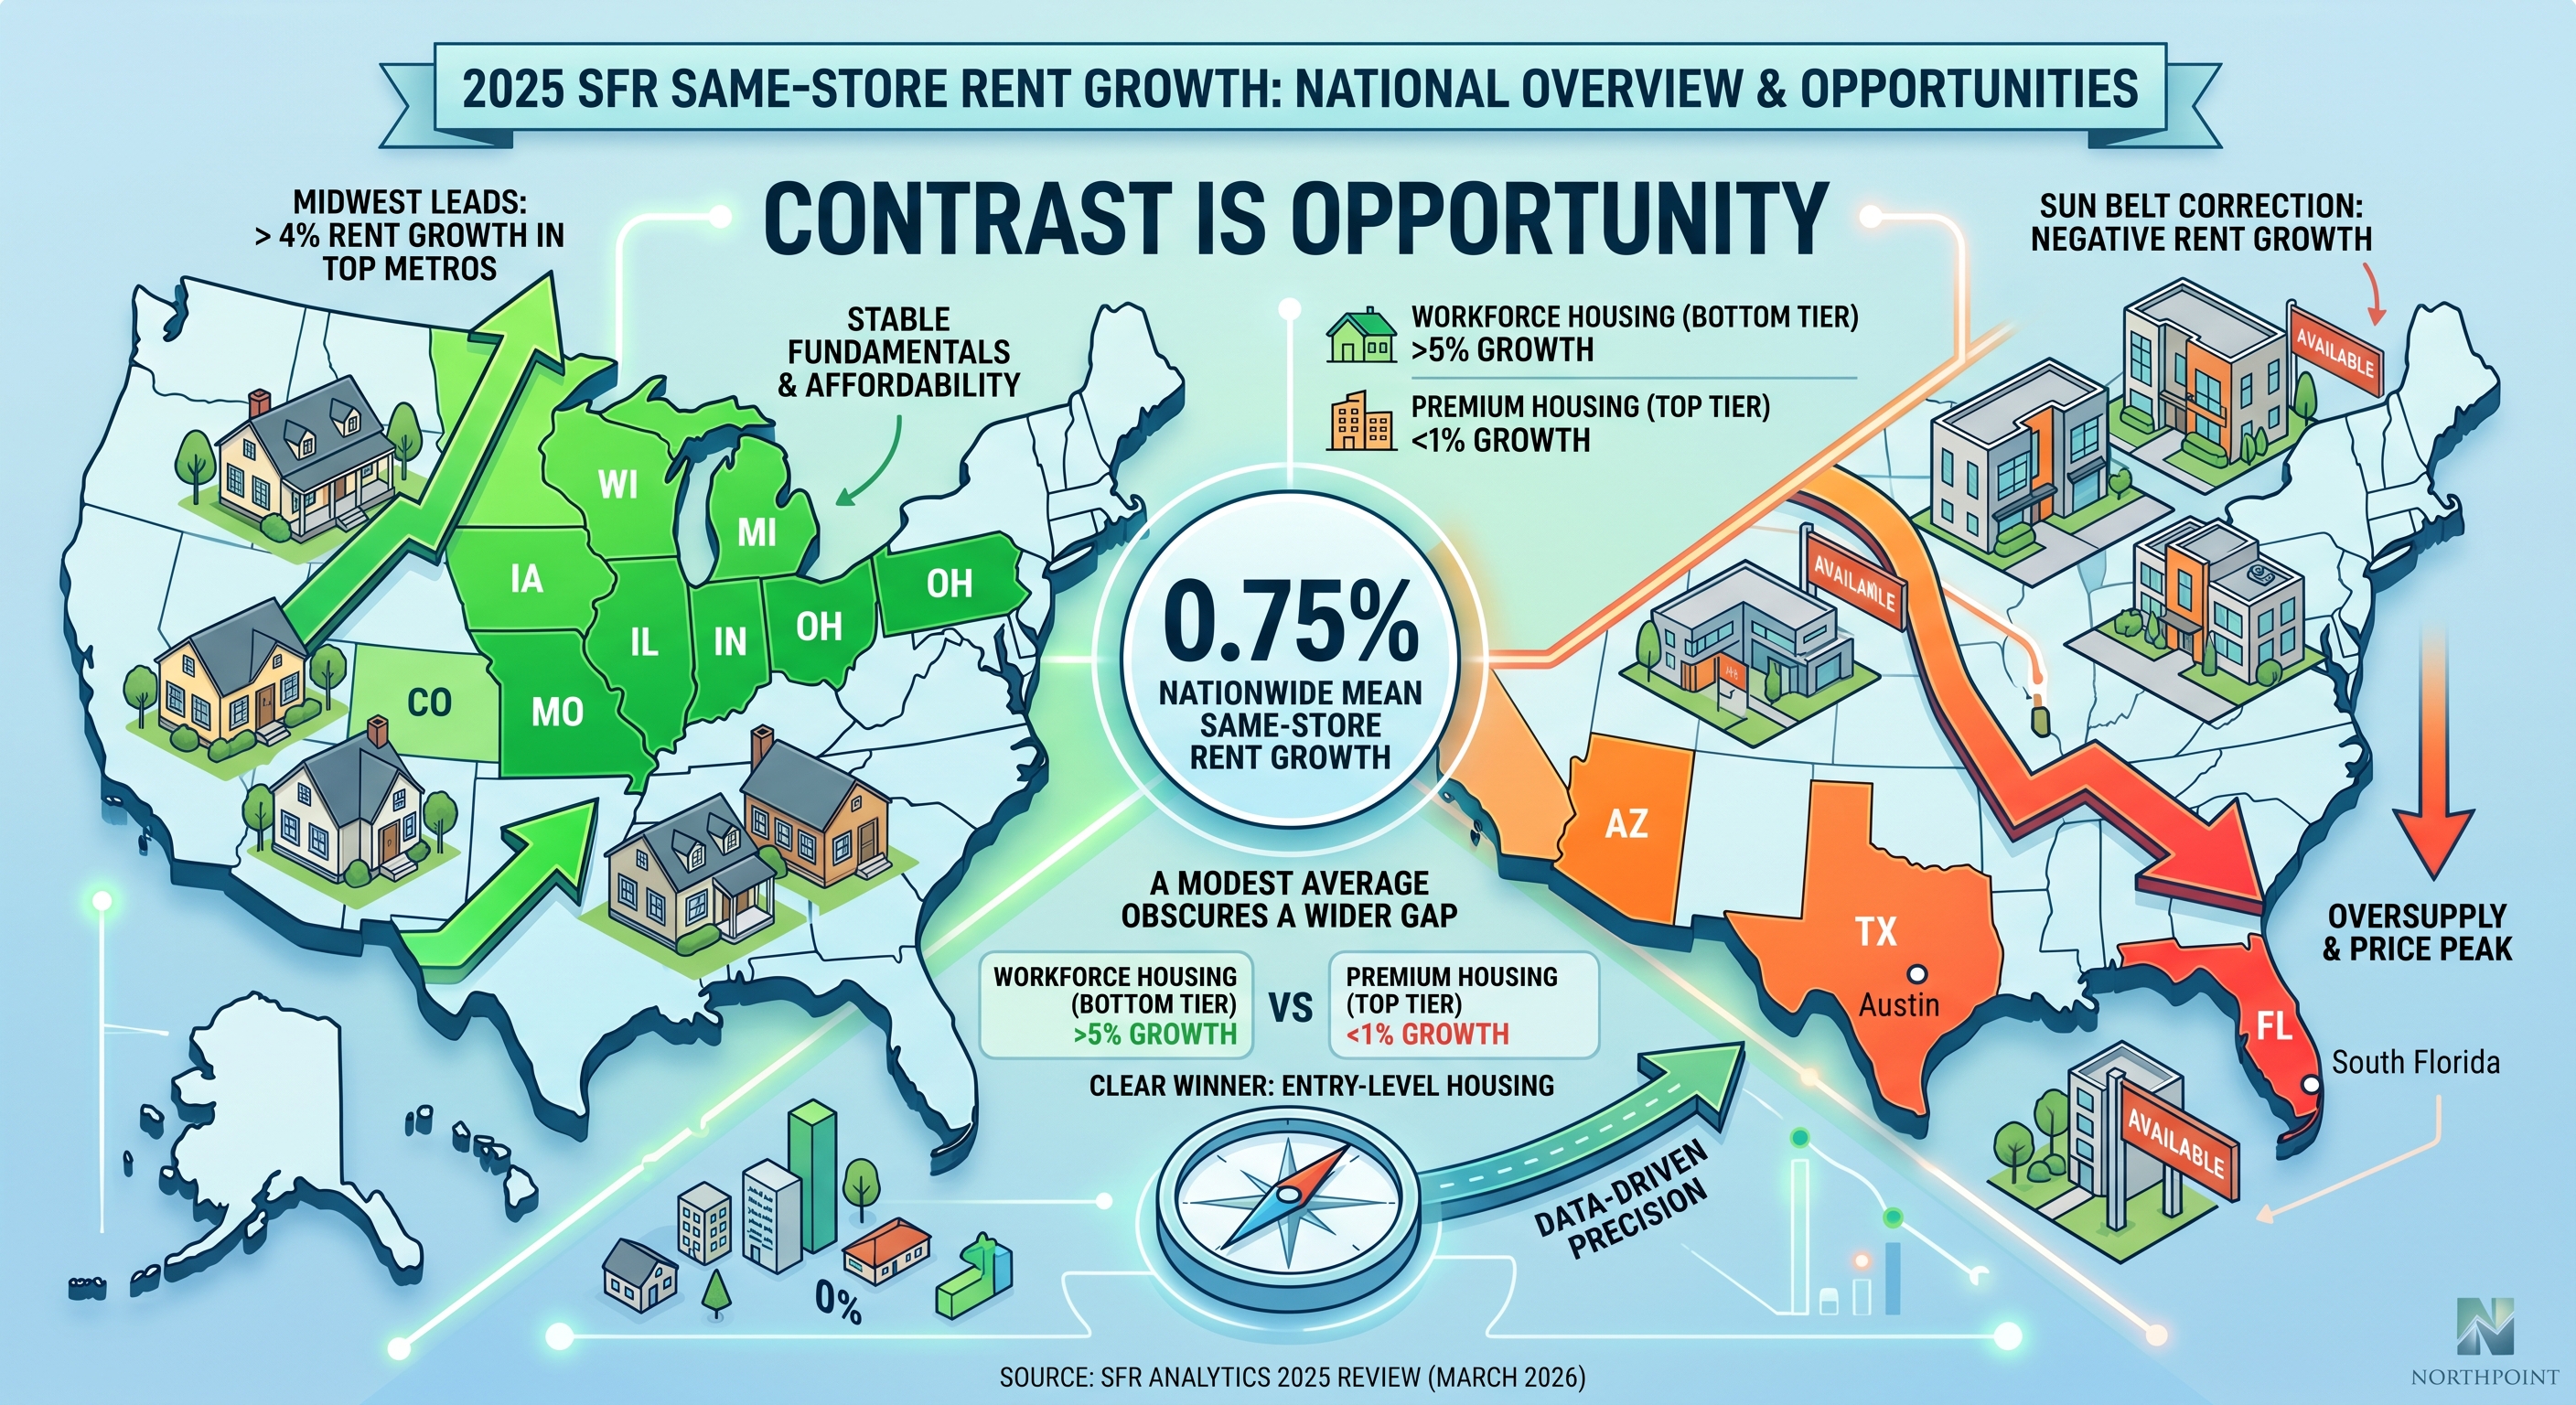
SFR Analytics recently published a full-year review of same-store rent growth across more than 450,000 single-family rentals, tracking properties that were leased in both 2024 and 2025. Because it measures the same homes year over year rather than broad market averages, it's one of the cleaner pictures of how the asset class actually performed. The headline number — 0.75% nationwide mean same-store rent growth — sounds modest. But underneath that average is a story full of contrast, and contrast is where opportunity lives.
The Midwest Is Doing the Heavy Lifting
While national growth stayed flat, several Midwest metros quietly outpaced the rest of the country, with some markets posting same-store rent growth above 4%. Illinois, Ohio, and Missouri led among the top 15 most active states. Rust Belt cities — long overlooked in favor of Sun Belt growth stories — dominated the list of top-performing markets at the city level.
This isn't a surprise to anyone who has been watching fundamentals. Midwest markets didn't overheat during the COVID run-up, which means they didn't have as far to fall. Affordability remained intact. Demand stayed consistent. Now the numbers reflect it.
The Sun Belt Correction Is Real
On the other side of the ledger, Florida, Arizona, and Texas all posted negative same-store rent growth for the year. Five of the ten worst-performing metros were located in South Florida alone. Austin and Asheville also landed in negative territory.
These are markets that saw explosive rent increases from 2020 through 2022. New supply caught up. Investor competition drove prices beyond what local incomes could sustain. The correction was predictable — and for investors who locked into those markets at peak values, it's now costing them on both the asset value and the income side simultaneously.
The lesson for 2026 is straightforward: chasing past performance in overbuilt Sun Belt metros is a costly strategy. The data says so plainly.
Workforce Housing Is the Clear Winner
Perhaps the most actionable finding from the analysis is this: across nearly every market studied, entry-level and workforce housing dramatically outperformed higher-priced rental tiers. When properties were sorted into value tiers within each market, the bottom tier showed consistent positive rent growth while the top tier trailed significantly. In some metros, the most affordable segment averaged over 5% same-store rent growth — while median-value properties in the same market came in closer to 1%.
This isn't a niche trend. It held across price bands, geographies, and market types. Workforce housing — the kind of home that working families actually need — is where demand is most durable and where rental income is most resilient.
For investors, this is a direct challenge to the instinct to buy at the top of the market in hopes of premium returns. The data consistently shows that affordably priced rentals in solid Midwest and Rust Belt markets are outperforming. At Northpoint, this aligns with what we see every day across our portfolio: reliable residents, consistent occupancy, and steady rent growth tend to cluster in the markets and price points that others overlook.
What This Means for Your Portfolio
If you're evaluating new acquisitions in 2026, three questions are worth asking in light of this data:
First, is the market you're targeting a Midwest or Rust Belt market with stable fundamentals, or is it a Sun Belt market still absorbing oversupply from the build boom? Second, are you buying in the workforce housing tier for that market, where demand is strongest and rent growth is most consistent? Third, are your current holdings in markets that outperformed last year — and if not, is it time to rebalance?
At Northpoint, we provide market performance data, local leasing intelligence, and portfolio-level analysis to help owners and acquisition clients answer exactly these questions. We operate in 40+ markets across 20+ states, which means we can tell you not just what the national data says, but what it means for a specific zip code you're considering.
Key Takeaway
The 2025 SFR rent growth data confirms what smart investors already suspected: this is a market that rewards precision over optimism. National averages obscure the wide gap between the markets and asset classes that are working and the ones that aren't. Knowing which side of that gap your portfolio sits on is the difference between compounding wealth and treading water.
If you want to talk through what the data means for your specific holdings or your next acquisition, our team is ready.
Data Attribution
Data referenced in this article is sourced from the SFR Analytics 2025 SFR Rent Growth Full Year Review, published March 2026. View the original analysis at SFR Analytics' Blog..